Graphs and charts for your Zoom presentations: the Do’s and Dont’s for better engagement
Sometimes describing data and quantitative results on a Zoom presentation can be a challenge if you don’t rely on graphs and charts to convey your information in an engaging way. Here are the do’s and dont’s to present your data effectively.

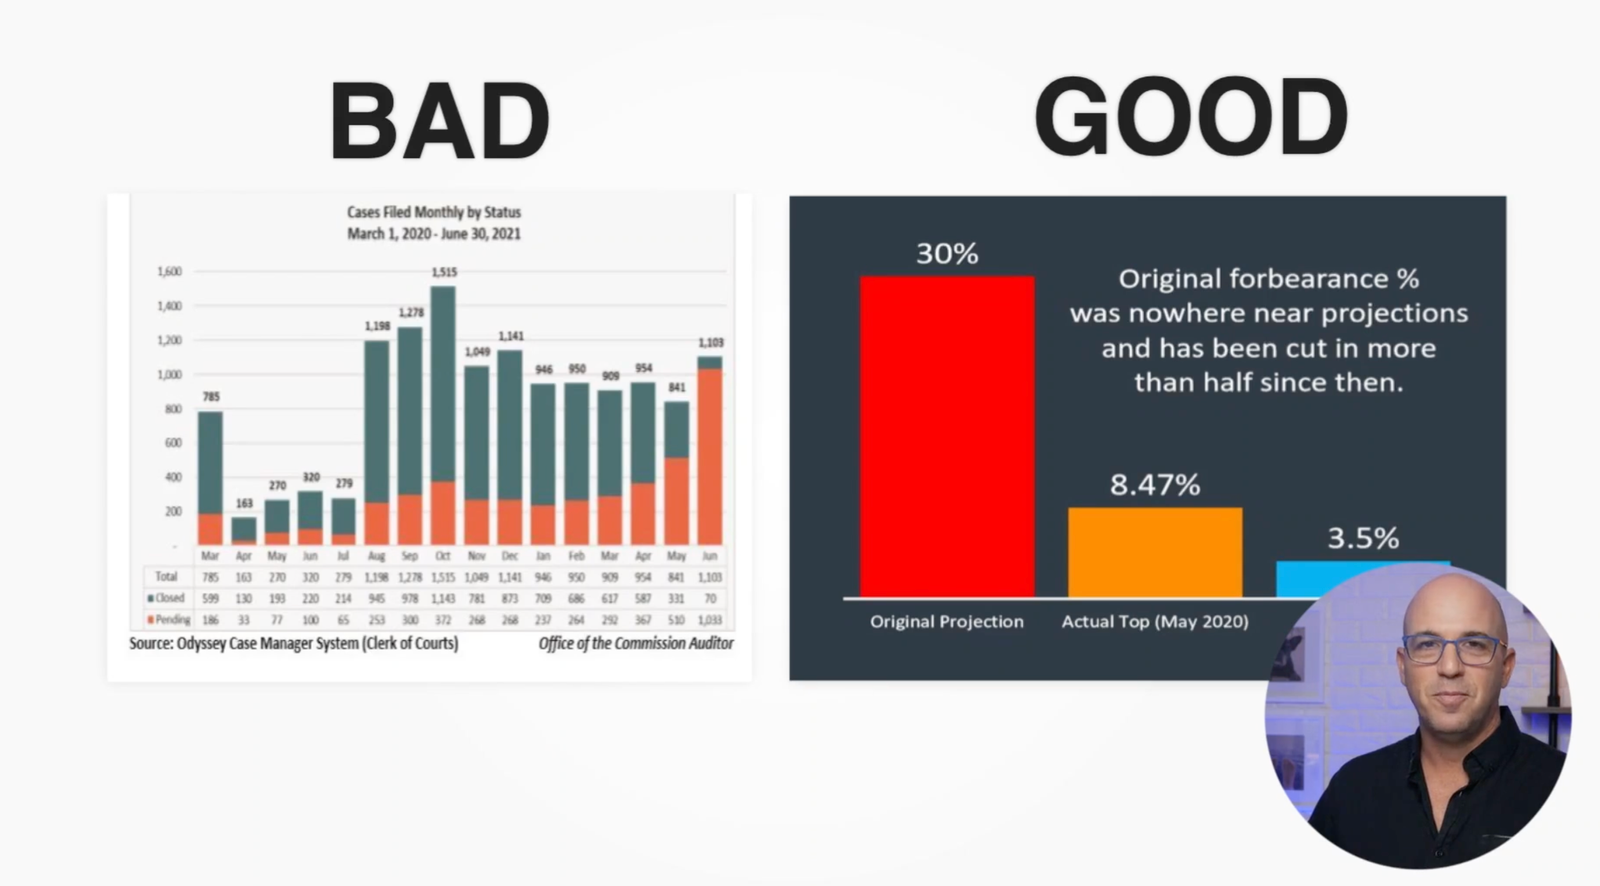
Frequently, we use graphs and charts to show a trend. This trend either goes up or down, the point of using graphs and charts is to display your results in an effective and clear way to your audience. Emphasis on results; don’t expect your audience to get to the conclusion on their own, it should be very clear to them in a few seconds from the chart in front of them. Since most of your attendees won’t be math experts, the goal of your presentations must be showing them your data in a way that is visually appealing and easy to understand.
Here are some do’s and dont’s that will help you make your graphs and charts on your Zoom presentations more engaging and clear :
1. DO simplify how you present your results.
Focus on relevant data, avoid adding anything that could distract your audience’s attention from the information you want to show. Get rid of shadows and over the top effects, this way you will get a clear slide, and therefore, easier to understand.
2. DON’T use excel charts with too much data.
Remember, you have only that much time for your audience to get the message of your presentation. If your slide is filled with numbers and data without any kind of organization, then your audience will have trouble understanding your results. This will make your slides easy to explain for you as well.
3. DO use the right graph and chart to present your data.
There are many types of graphs and charts. Each one has a specific use according to the kind of data you want to present. For instance, pie charts are great when comparing a few elements because they display the information in a way that is visually clear. On the other hand, if you have a lot of elements you want to compare in your presentation using bar graphics would improve the readability of the data.
4. DON’T use small fonts and numbers in your graphics.
The point of the slide is to present the data as clearly as possible. Using small numbers and letters would make the reading process difficult for your audience. Try to use big fonts and make them easy to read. No matter if you are explaining the graphics, your audience needs to capture your message visually as well. Include a title, big fonts, colors and images if applicable.
5. DO plan your presentation to be looked at on small devices as well.
While presenting on Zoom, think about those who are watching you on their phones or tablets. Plan your presentation around this segment of your audience too. Make your slides readable and simple, so the people who are watching you from their mobile devices can appreciate and understand what you are presenting. Remember to be clear, to use the whole space, and deliver your results in a simple and precise way.
So, when it comes to graphs and charts for your Zoom presentations simplicity is key. This way no matter the level of expertise your audience has, you will be sure that everyone understands the information you are providing them and most importantly you are creating an engaging and interesting experience for them. If you want to know how to make your presentation visually attractive through visual communication you should read about "The 5 second rule" here.
